Chapter 17 Favorite data visualization libraries or tools
Favorite data visualization libraries or tools are shown in the graph below
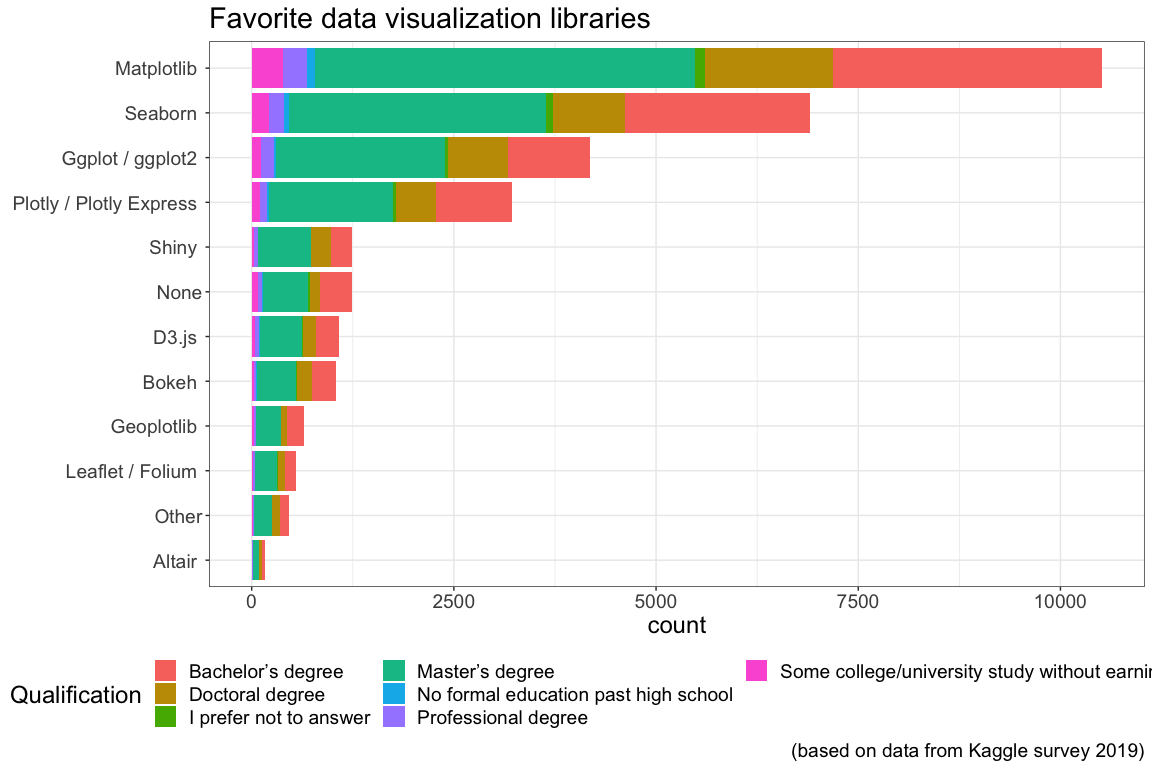
The last Qualification which is cut off in the legend in the plot above reads “Some college/university study without earning a bachelor’s degree”
With Matplotlib there is a clear winner, however, ggplot2 is the clear favorite in the R world.
- Matplotlib
- Matplotlib is a Python 2D plotting library which produces publication quality figures in a variety of hard copy formats and interactive environments across platforms
- Seaborn
- Seaborn is a Python data visualization library based on matplotlib. It provides a high-level interface for drawing attractive and informative statistical graphics.
- ggplot2
- ggplot2 is a system for declaratively creating graphics, based on The Grammar of Graphics
- Available for R and Python
- Plotly
- Interactive plots
- Available for R and Python
- D3.js
- Data-Driven Documents
- Javascript based
- Can be used from R and Python
- Bokeh
- Bokeh is an interactive visualization library for modern web browsers.